Other Data Analysis & Visualization
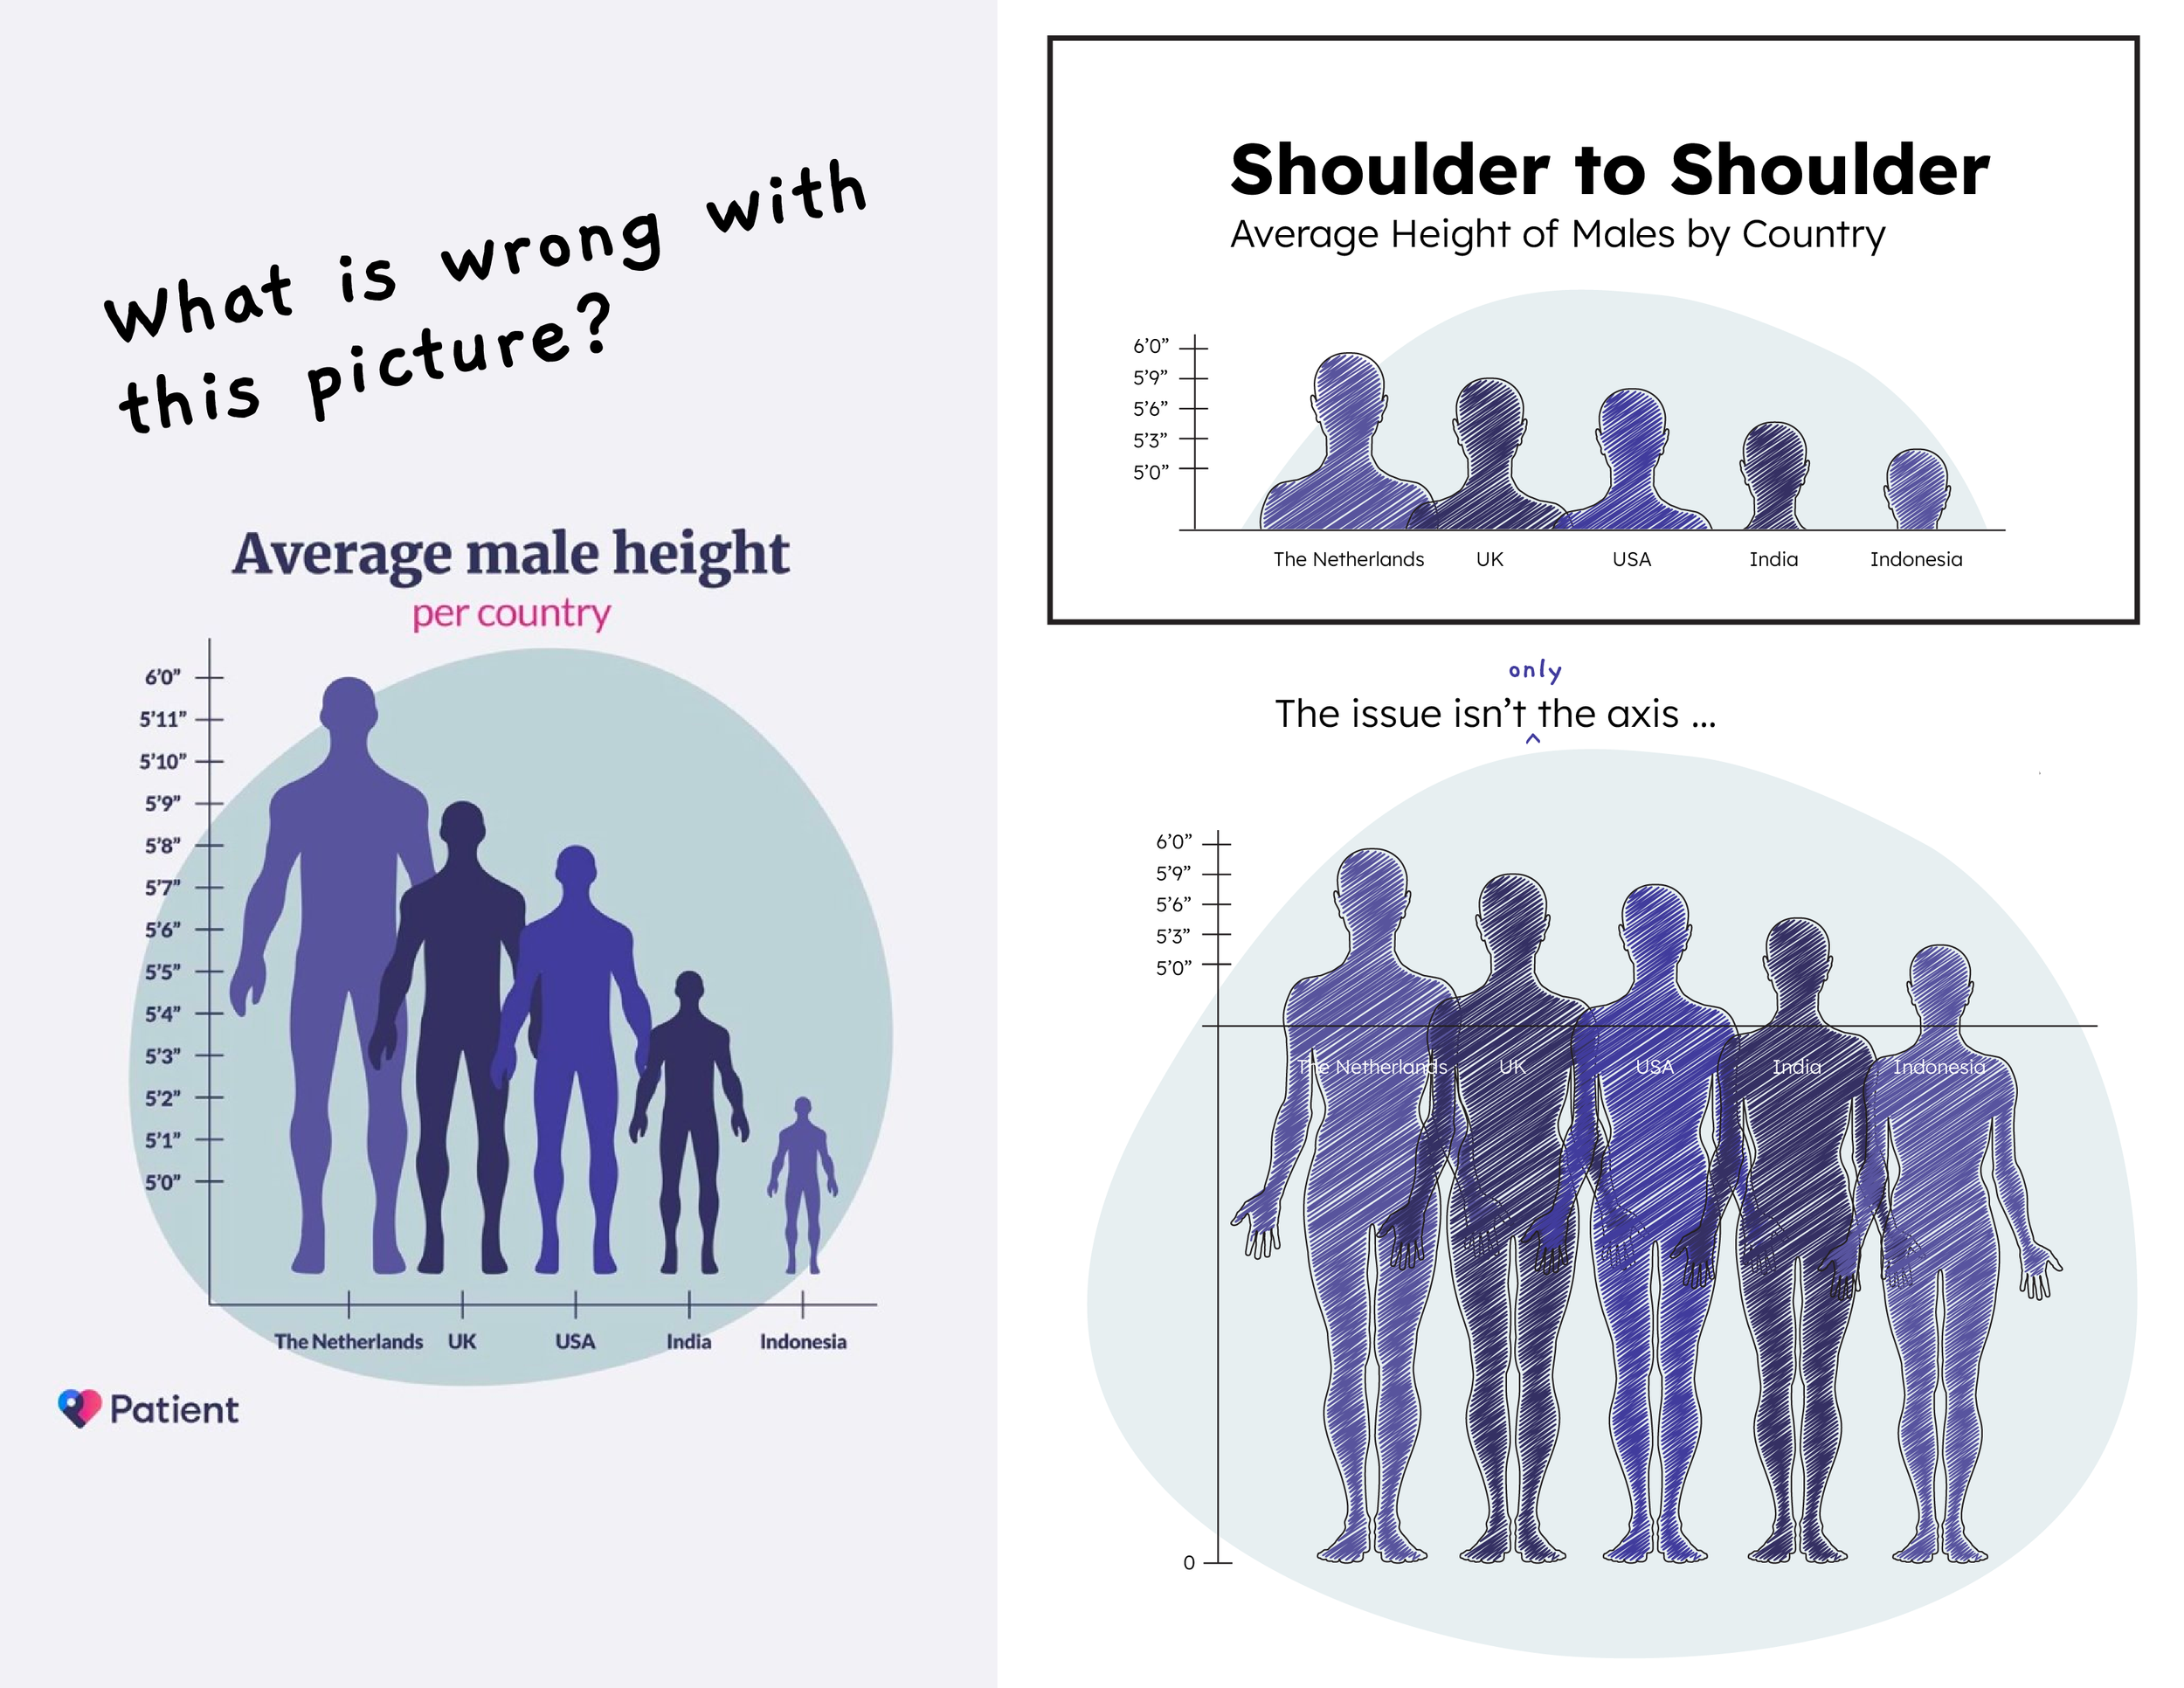
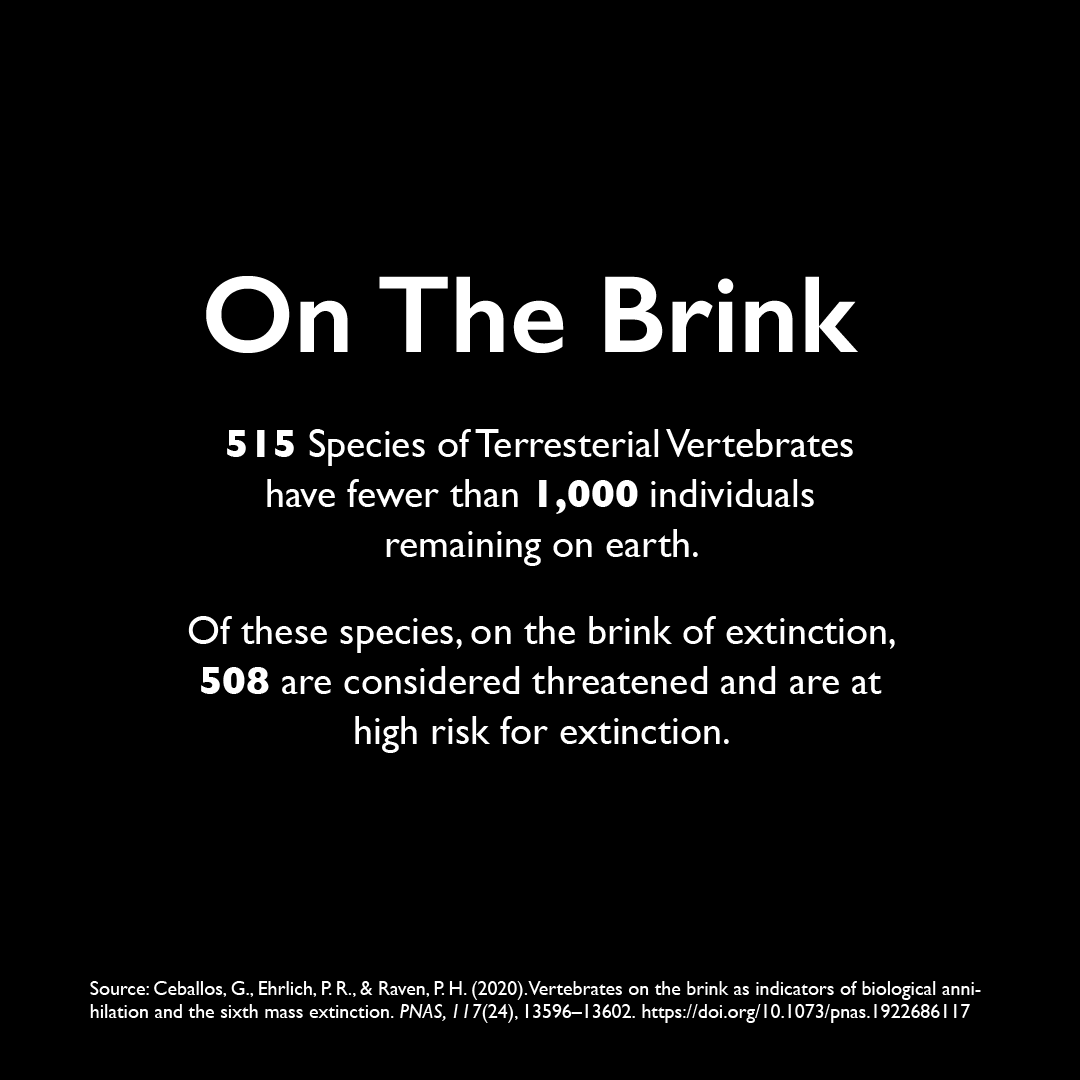
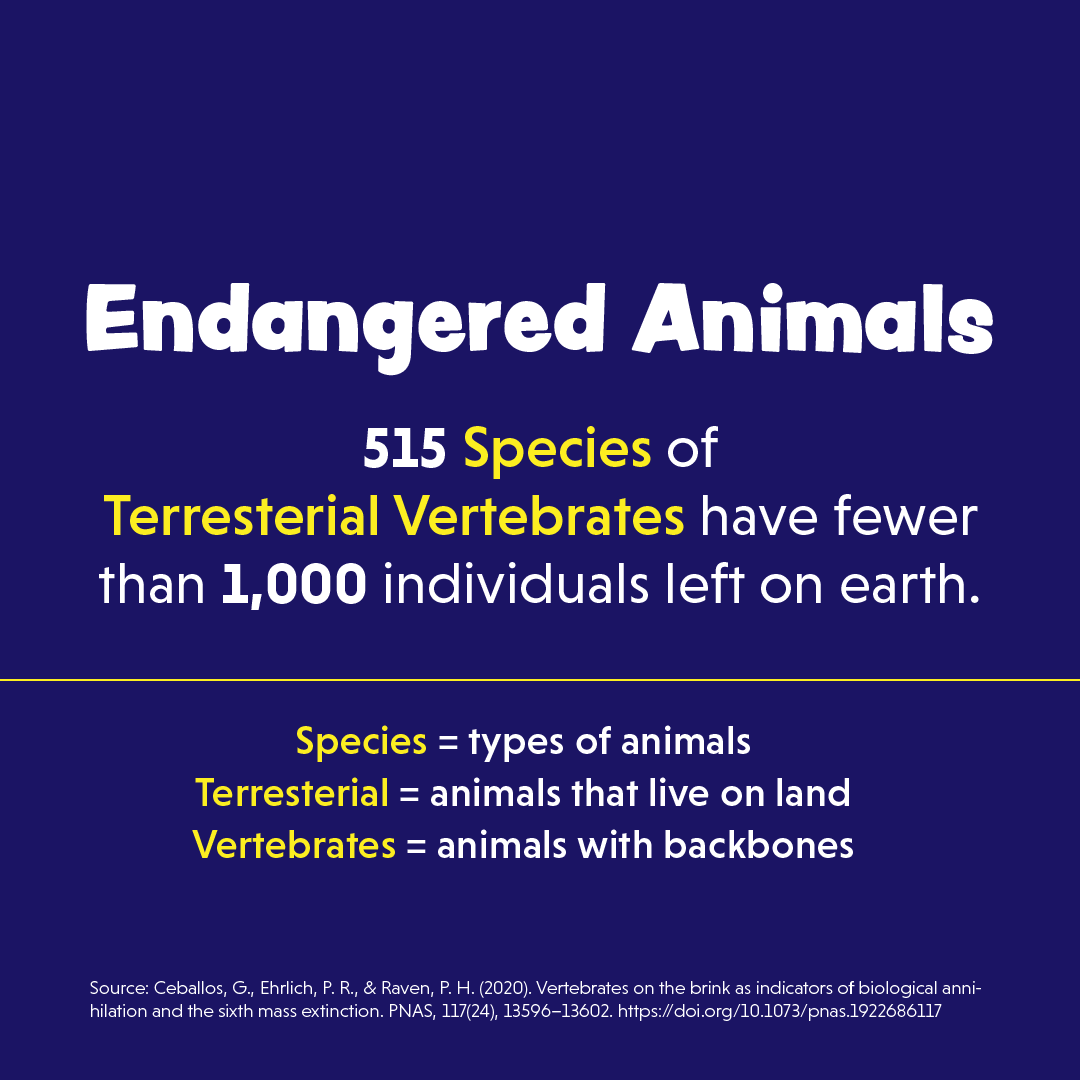
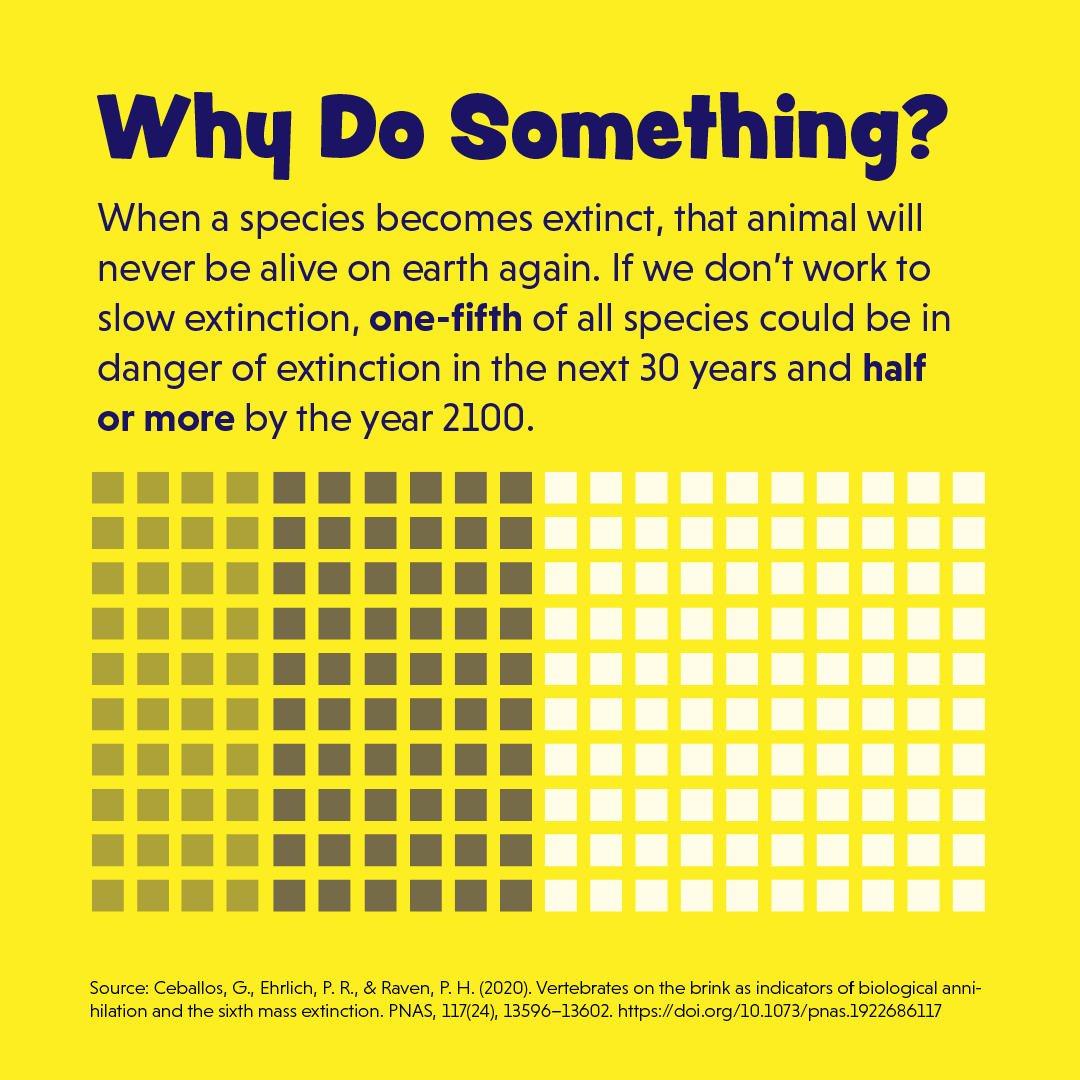
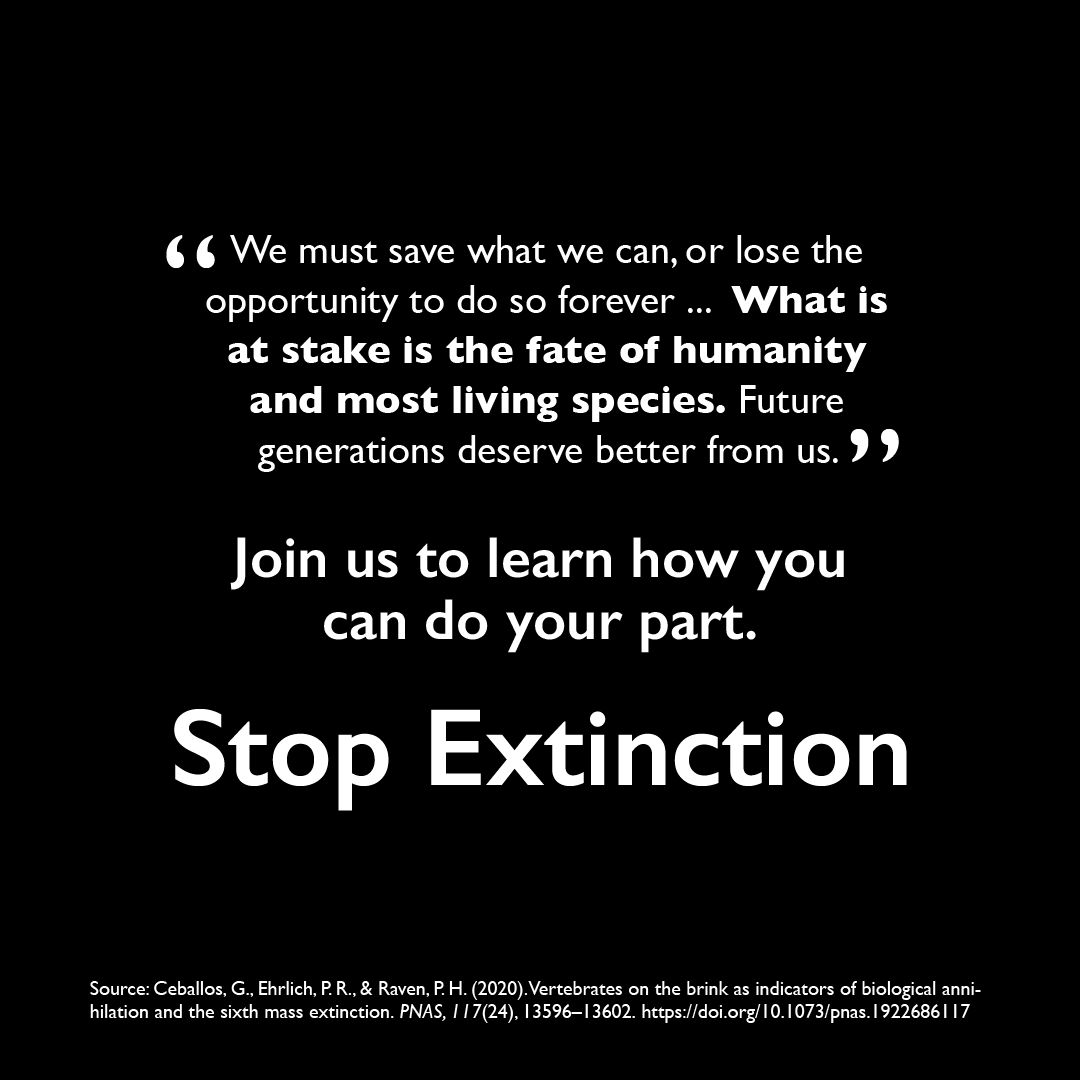
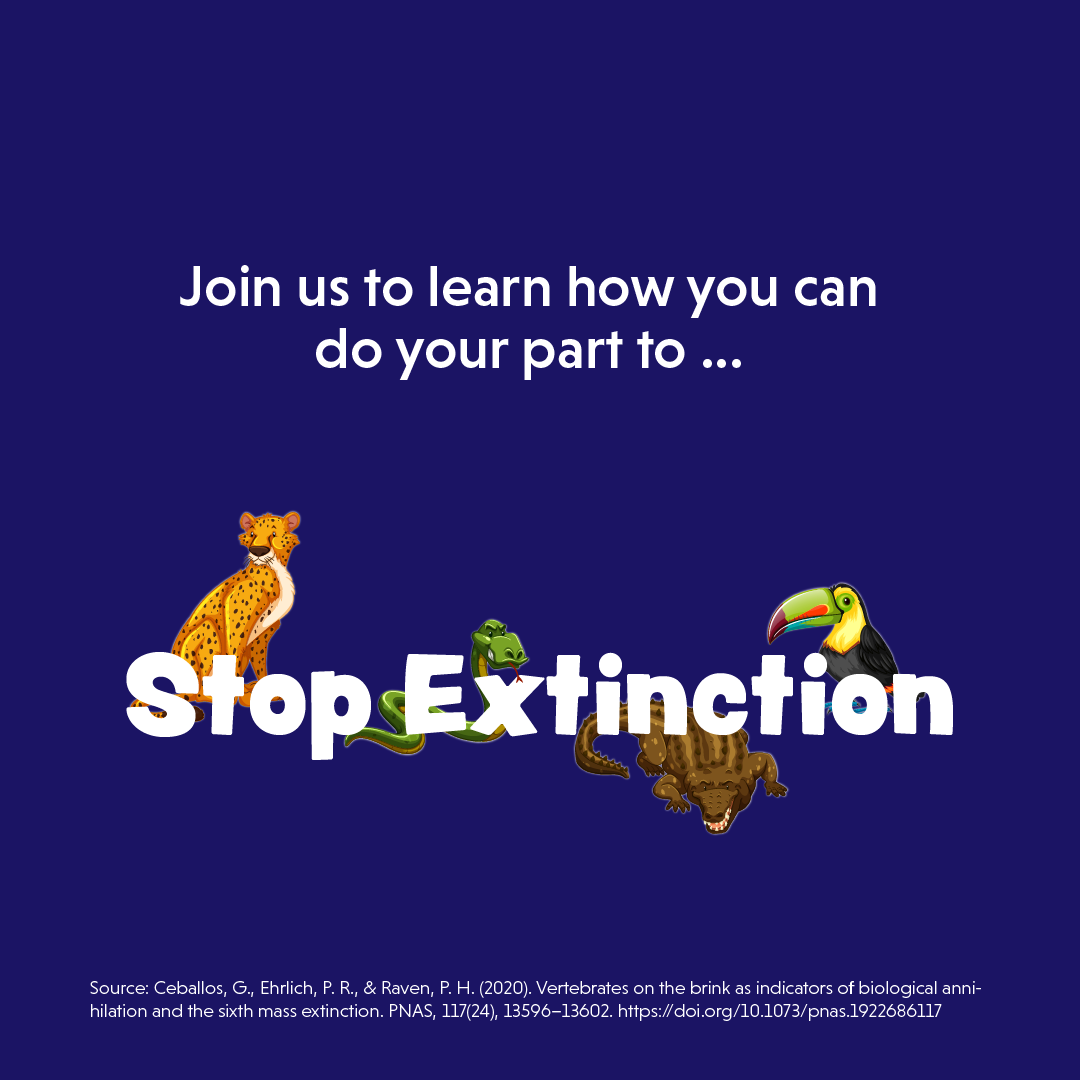
A data storytelling project where the same information was designed for two audiences.

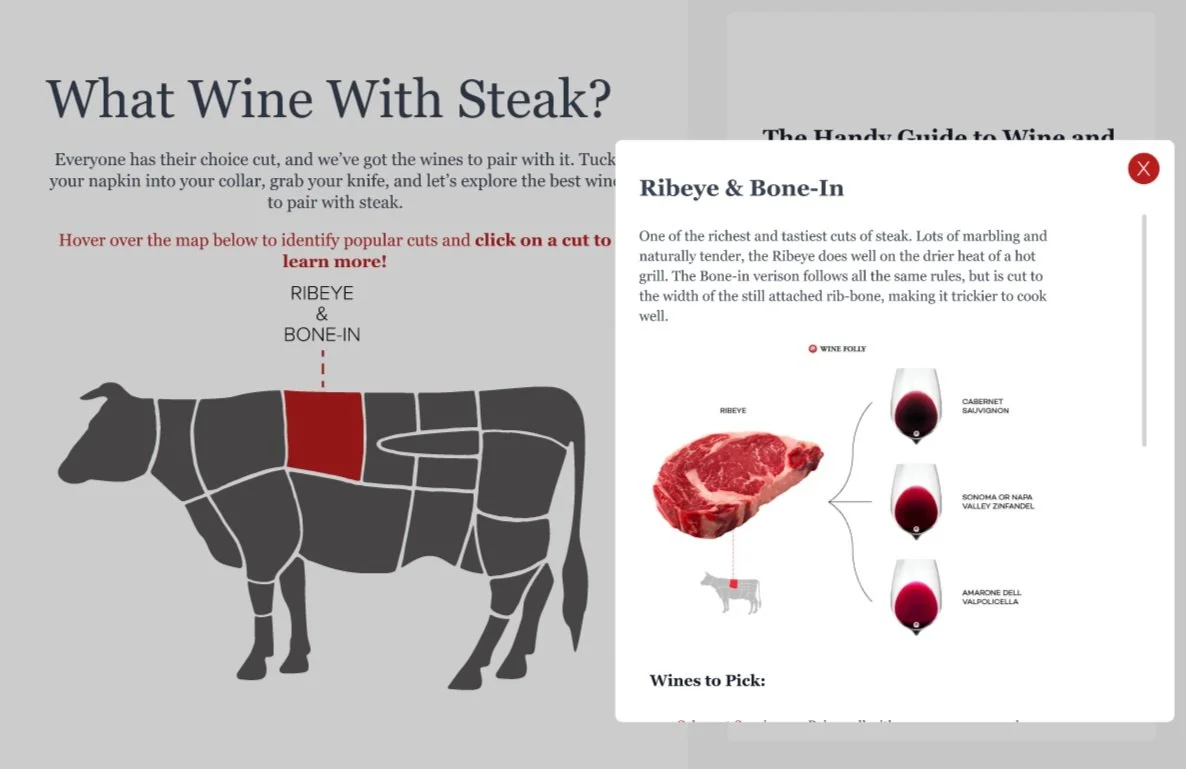
An interactive wine guide prototyped in figma.
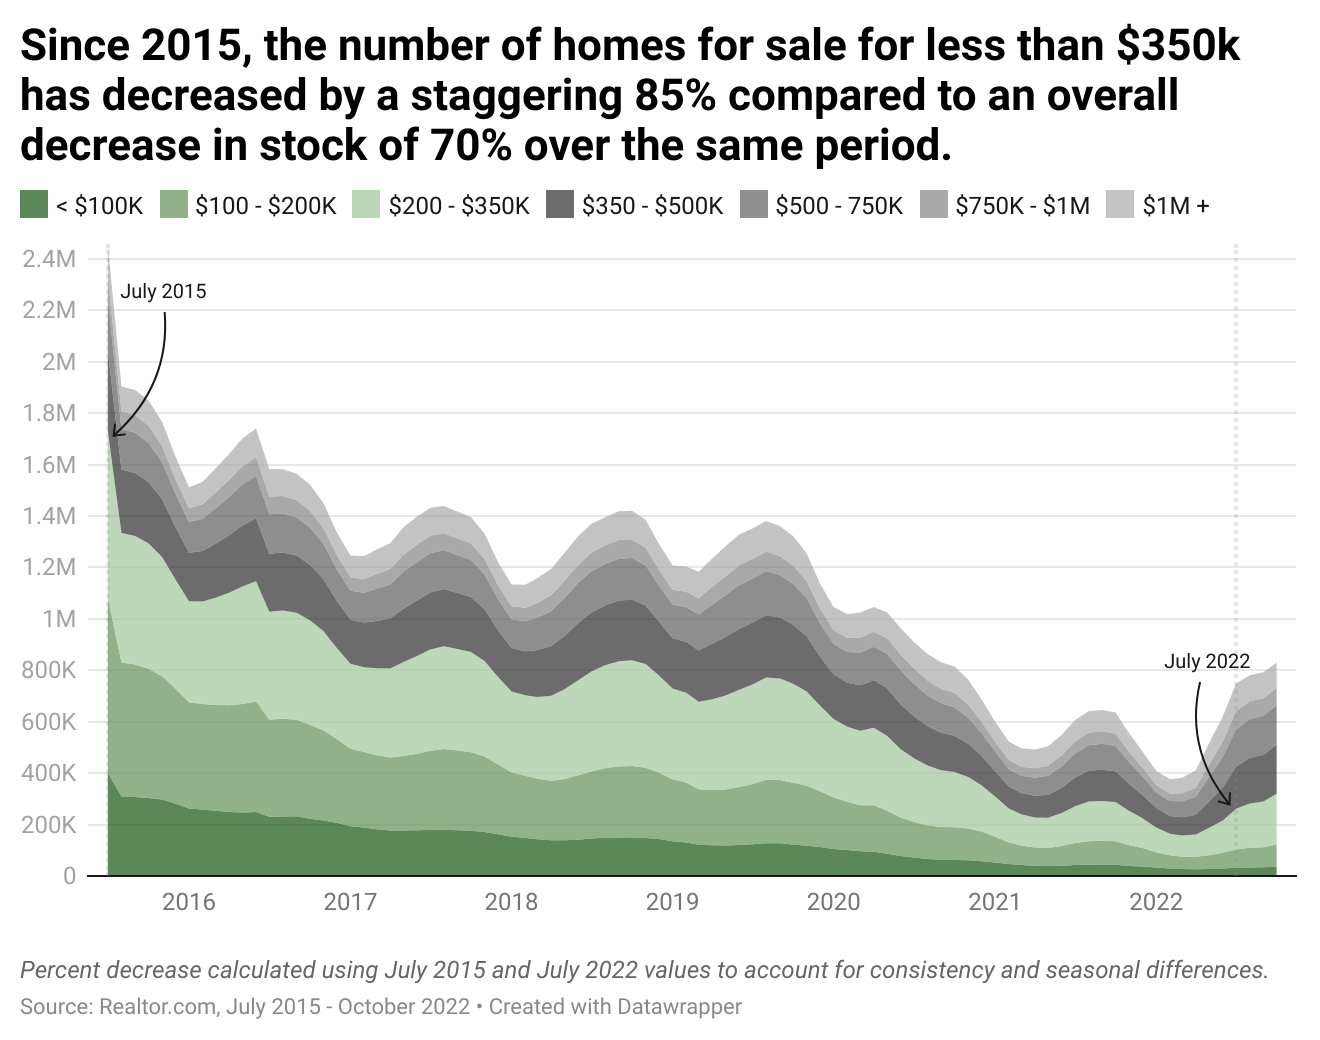
A group project introducing Community Land Trusts and housing data in a scrolling article format.

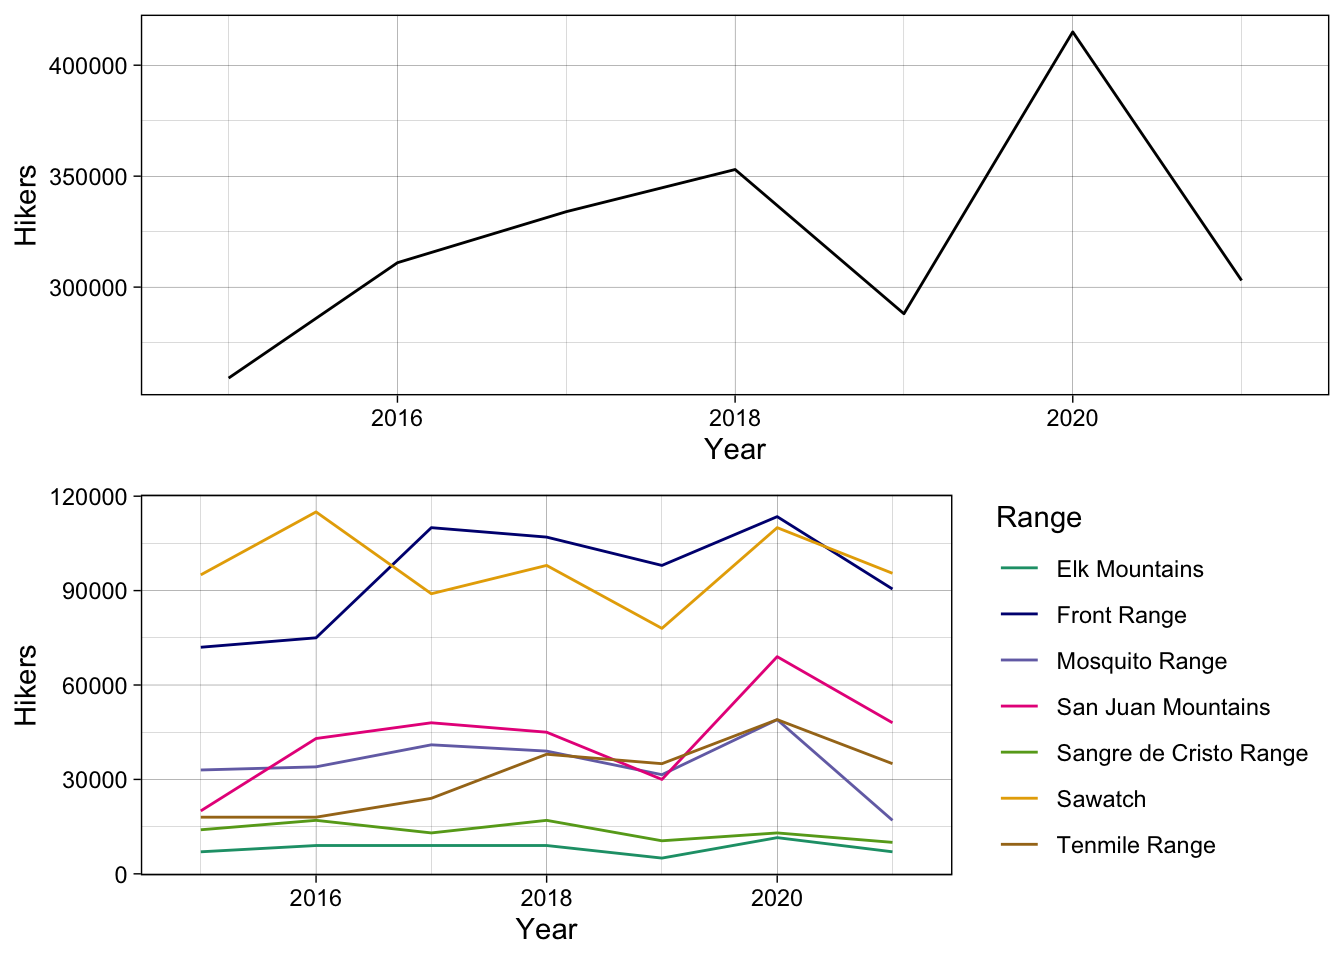
Data exploration and distribution analysis of Colorado 14’ers in R Studio using ggplot2.

Other fun with data!