Exploring Awe
Summer 2023 MICA Data Analytics and Visualization Capstone Award Winner
This printable booklet explores the science of awe, visualizing the current research and inviting readers to map their own awe experiences.
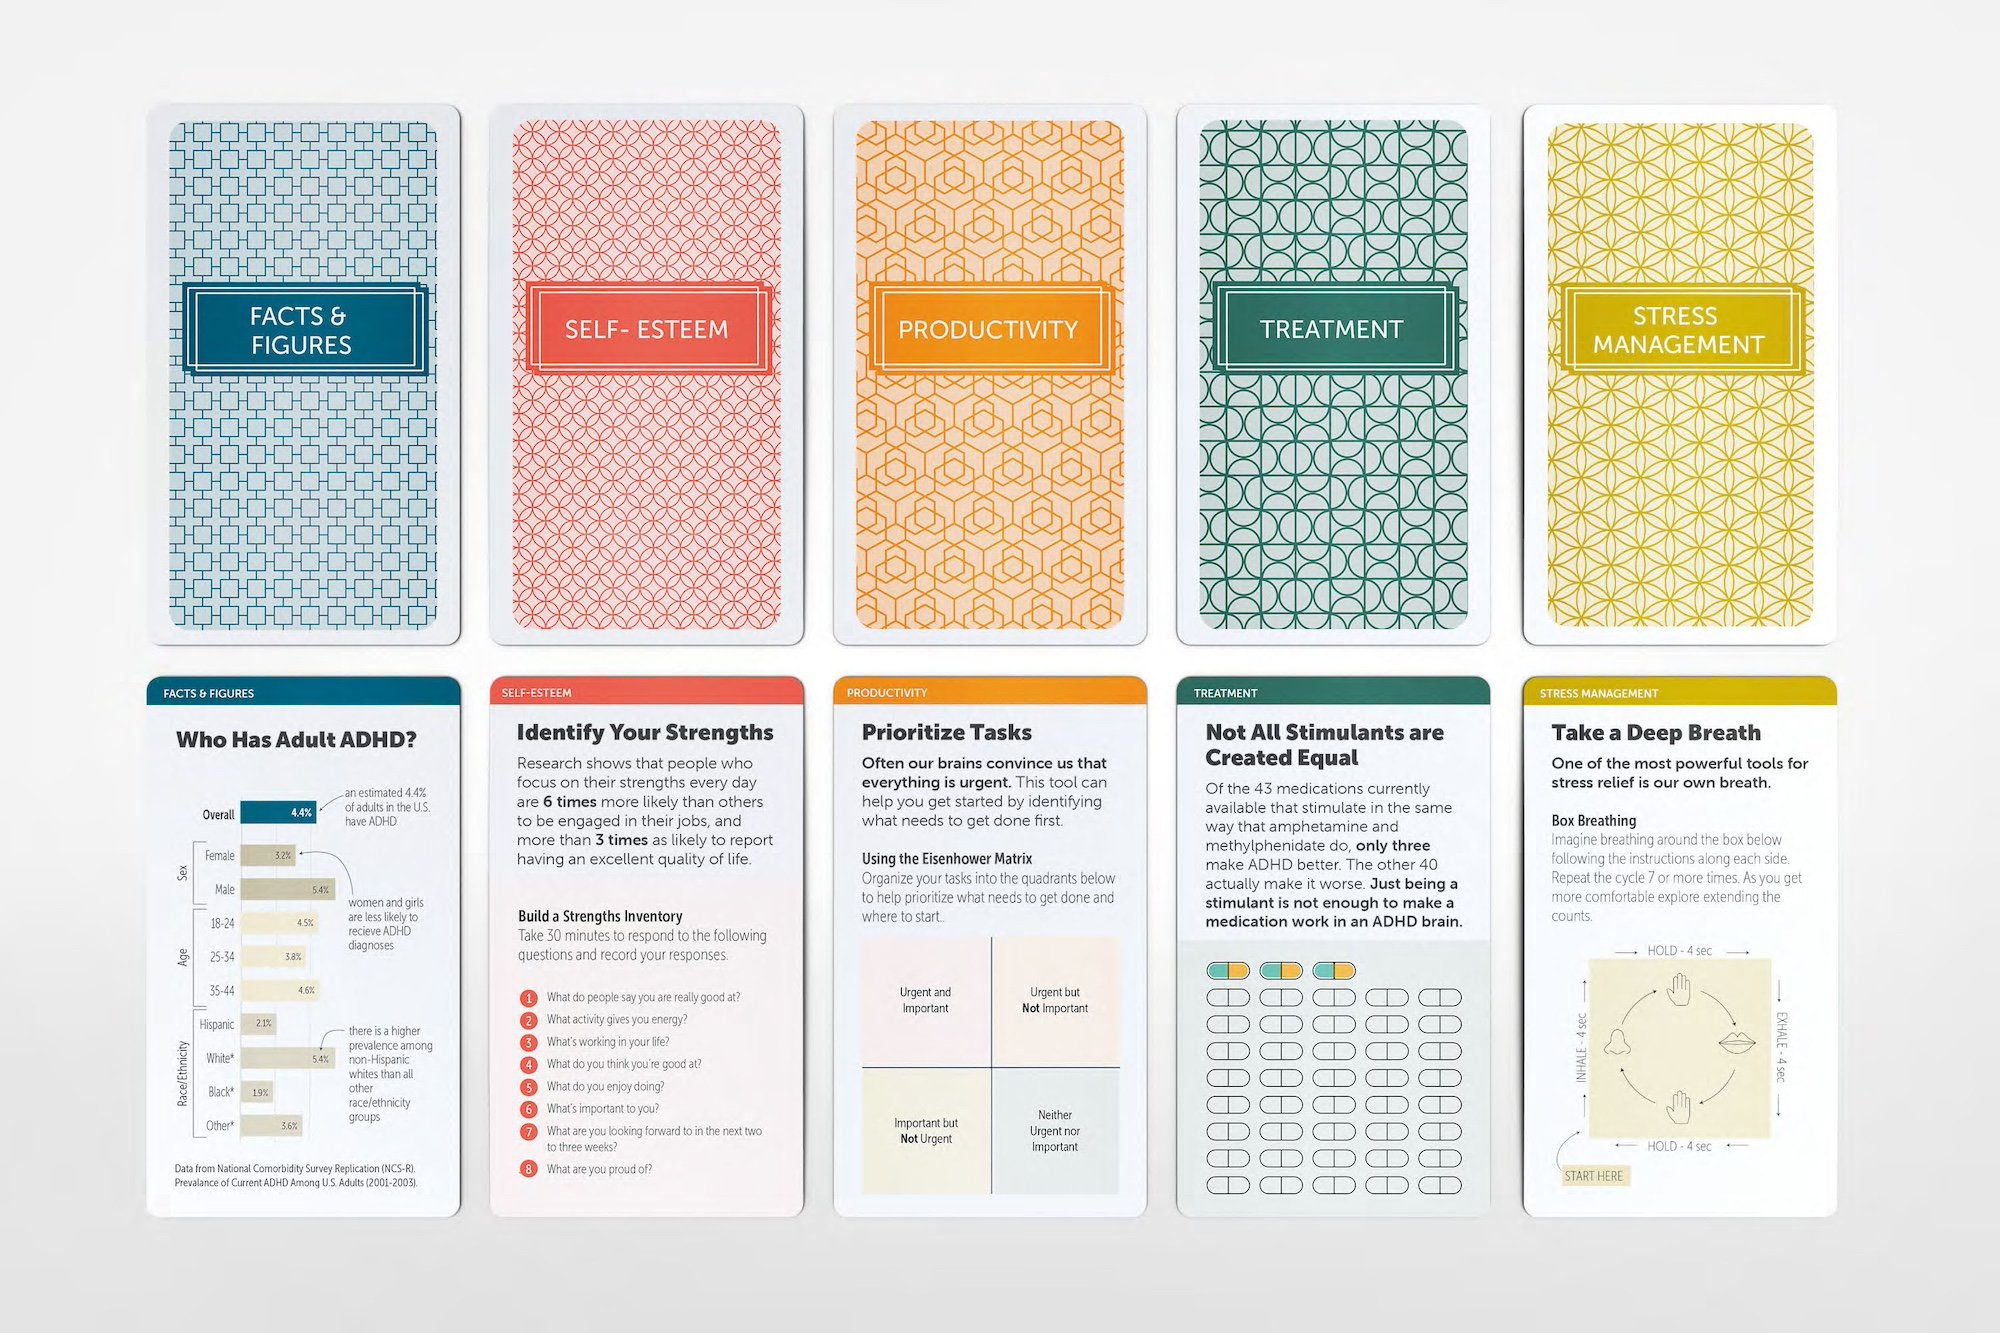
Adult ADHD Strategy Cards
This prototype for adult ADHD strategy cards combines colorful and creative design and visualization to share data and strategies in an interactive and fun way.
Other Data Analysis & Visualization
A collection of other examples of data exploration and visualization
Contextus Science
Designed and developed a cohesive identity, branding, and design system for Contextus Science with an emphasis on document layouts and templates that can be edited in google docs and slides.
Loneliness (Figma prototype)
Created for a Visual Storytelling course, this prototype of a mobile campaign to raise awareness on loneliness makes use of horizontal scrolling and engaging visuals to lead viewers through the information.
Emily McCort, MD
Identity and branding for a local mental health practitioner, including logo design and branding.
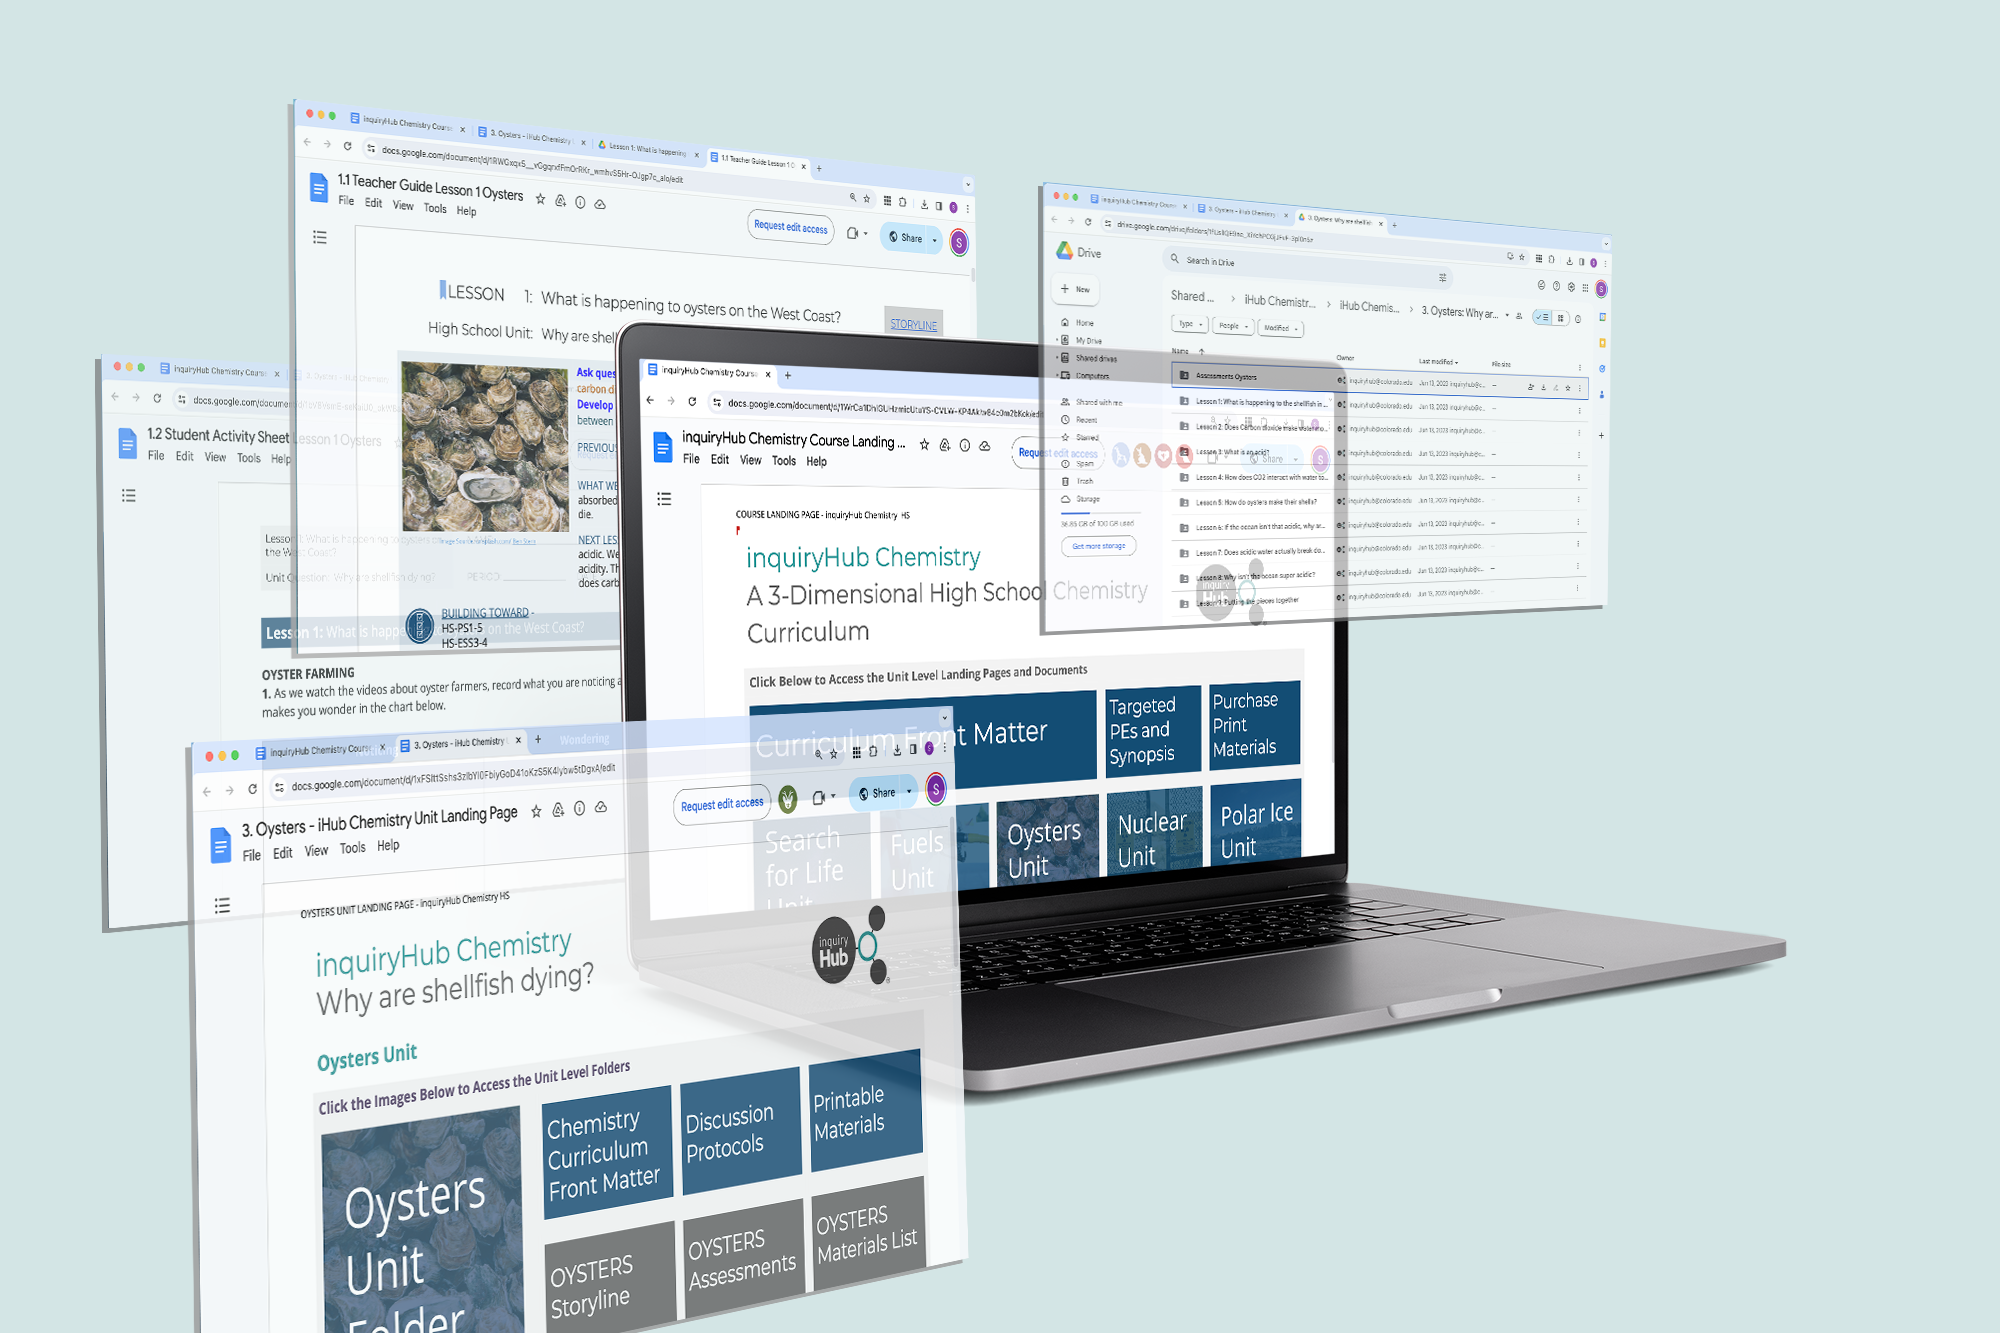
Inquiry hub (iHub)
Co-designed a highly adaptable, iterative and functional design system that delivers discovery based science curriculum using Google Drive as the platform.
Full Cadence Consulting
Identity and branding for Full Cadence Consulting, including logo design, document design, and the development of editable social media templates.


